With the election of former Vice President Joe Biden as the 46th President of the United States, pundits and political analysts have set about answering the perennial election cycle question: Why did people vote for one candidate over another?
Analyses of Donald Trump’s 2016 victory generally came to two conclusions. First, the long list of voter attitudes and identities that mattered in previous elections continued to matter in that election. The political party that individuals associated with, their political ideologies, their assessment of the economy, and their attitudes on policy were, to greater and lesser extents, predictive of their vote for president in ways similar to prior elections. This conclusion spoke to the relative stability in the way that voters were making choices.
The second conclusion suggests there was something different about 2016. Several attitudes were found to be more predictive that cycle than they were in the 2012 presidential race. In a past analysis of the VOTER Survey (Views of the Electorate Research Survey), John Sides found that one such factor was Americans’ feelings about Muslims, which became a stronger predictor of vote choice in 2016 than it was in 2012. This increased salience was in line with much of the discourse about the 2016 election cycle—namely, that issues related to race, immigration, and religion played a more central role than they had in 2012.
New data from Democracy Fund Voter Study Group suggests that attitudes toward Muslims and the relationship of those attitudes to voters’ choices changed during the 2020 election cycle.
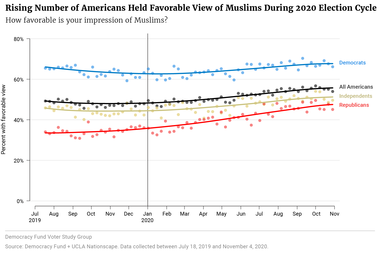
First, the number of Americans who said they have a somewhat or very favorable attitude toward Muslims rose noticeably. According to data from the Democracy Fund + UCLA Nationscape™ survey, 49 percent of Americans held a favorable view of Muslims in July 2019. By the week leading up to the 2020 election, the proportion had risen to 56 percent.(1)
(1) Values reported here represent the smoothed average displayed in the figure as a line. These values were derived using a LOWESS on the weekly averages produced for each group.
Figure 1

This change was driven almost exclusively by shifts among Republicans and Independents. Republicans were notably more likely to express a favorable attitude toward Muslims the week before the election (48 percent) than they were in July 2019 (34 percent). A smaller but directionally similar shift occurred among Independents (51 percent vs. 46 percent). There was no notable shift among Democrats (66 percent vs. 68 percent).
This trend was not limited to data from the Nationscape survey. In the VOTER Survey, which draws on an established panel of individuals who have been periodically surveyed since December 2011, respondents were asked to rate their feelings about Muslims in both November 2019 and September 2020. In this survey, these attitudes were measured through the use of a “feeling thermometer,” where respondents were asked to classify their feelings on a scale that ranges from 0 (“very cold”) to 100 (“very warm”). The average thermometer rating survey participants gave when asked about Muslims rose from 52 to 57 over this time period, indicating an overall “warming” of their feelings toward this group. Once again, this shift was mostly driven by Republicans (36 to 43) and Independents (50 to 56). There was a smaller shift among Democrats (64 to 68).
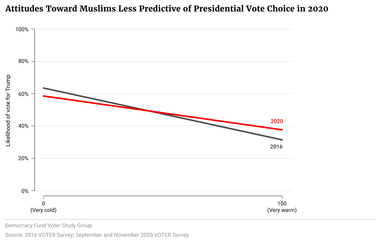
These attitudinal shifts coincided with a change in the relationship between attitudes toward Muslims and Americans’ probability of voting for Trump. Using data from the VOTER Survey, we ran two regression models that predicted the probability of voting for the Republican candidate in 2016 and 2020. These regressions include the thermometer rating with regard to Muslims and a number of demographic variables.(2)
While the relationship was negative in both years—meaning that “warmer” ratings on the thermometer were correlated to a lower likelihood of voting for Trump—the results suggest that Americans’ feelings toward Muslims were less predictive of their votes in 2020 than in 2016. For example, the data from 2016 would suggest that someone rating their feelings toward Muslims as a 0 (“very cold”) would be 38 percentage points more likely to vote for Trump than someone who rated their feelings as 100 (“very warm”). By contrast, someone with a very cold rating in 2020 would be only 24 percentage points more likely to vote for Trump in 2020 than someone with a very warm rating.
(2) The logit models controlled for the age, education, gender, race, and party affiliation, were weighted for those who participated in both the November 2016 and September 2020 iterations of the VOTER Survey.
Figure 2

In short, as attitudes about Muslim Americans became more favorable—a shift that might have led fewer people to vote for Trump—it was also the case that these attitudes slightly decoupled from the choices Americans made when voting for president. What is less clear is why these changes occurred.
One possible explanation for the rising favorability might be the relative decline in news stories about Muslims during the 2020 election cycle. While the 2016 election was heavily inflected with stories about Muslims—due in no small part to the Trump campaign’s antagonistic focus on immigration and, more specifically, Muslim immigration—the 2020 media landscape was dominated by stories related to COVID-19, the economic recession, and massive protests following the killing of George Floyd.
This decline in coverage matters because stories related to Muslims are disproportionately negative. The Media Portrayals of Minorities Project’s 2019 study of U.S. newspaper coverage from 2014 to 2019 found that Muslims were consistently covered more negatively than any other American minority group, largely due to the association of Muslims with foreign conflict zones, terrorism, immigration, and the broader theme of law and order. These associations are so prevalent in U.S. media that organizations like the Institute for Social and Political Understanding (ISPU) developed resources to help journalists report stories about Muslims more equitably. During the same five-year period, Muslims also received about half as much coverage as other minority groups on cultural topics like art and film, which tend to be perceived more positively as contributions to American society.
As a result, Americans who primarily relied on the media to shape their understanding of Muslims may have been offered a different diet of information this last year.
It is worth recognizing that the measures analyzed here—favorability ratings and thermometer questions—are a proxy for Americans’ attitudes toward Muslims. And while media coverage may push and pull these proxy measures, people’s attitudes are also influenced by current affairs and entrenched by decades of messaging from political, social, and economic elites. The status of Muslims as a bellwether for nativist sentiment in the U.S.—even when such sentiments are not informed by a specific, well-articulated prejudice against Muslims—has not been erased by the events of 2020.
To the extent that these proxy measures are capturing a real shift in Americans’ underlying attitudes, there is no guarantee that this trend will continue into the future or that it won’t revert. One need only look to the Republican party’s response to President Biden’s executive order reversing the ban on immigrants from several Muslim-majority countries, as well as patterns of Islamophobic behavior exhibited by a sitting congressional representative and several candidates, to imagine how sentiments might change going forward.
It is also important to note the unresolved issues with public opinion polling that became apparent during the 2020 election cycle. In particular, it would appear that some kind of non-response issue among Republican-leaning Americans is leading polls to systematically underestimate the GOP’s electoral margins. The changes over time presented here are far larger than the errors in horse-race polling we saw in the 2020 election, making it less likely that our overarching findings could be explained as a methodological artifact. Still, these factors should be kept in mind.
The trends outlined here stand out in an unprecedented year that tested many assumptions about the American electorate and its priorities. It remains to be seen how such attitudes might evolve going forward.
Subscribe to our mailing list for updates on new reports, survey data releases, and other upcoming events.