Elections, Executive Branch, Political Parties

Key Findings
After months of campaigning, the Democratic presidential nomination contest formally begins on February 3 when Iowans meet to caucus. Right now, the race is wide open. According to a forecast by FiveThirtyEight, the apparent frontrunner, Joe Biden, has less than a 50 percent chance of winning a majority of pledged delegates to the Democratic National Convention. Bernie Sanders, who has been gaining in national polls and leads in some Iowa polls, has nearly a one-in-three chance. There is even a reasonable chance — currently estimated at 15 percent — that no candidate arrives at the convention with a majority of delegates.(i)
This uncertainty is creating consternation for many Democrats. As a recent New York Times story put it, “The lack of a united front has many party leaders anxious — and for good reason.”(ii)
New data from the Democracy Fund Voter Study Group shed important light on the state of the Democratic primary. The December 2019 VOTER Survey (Views of the Electorate Research Survey), was conducted from November 22 to December 23, 2019. It is distinct among public polls because it draws from a longstanding panel of voters who have been interviewed periodically since December 2011, including after the 2012 and 2016 elections. The nature of this survey allows us to track the same group of voters over time and see how their views today correspond to what they said and did in these two earlier elections. And with the addition of new samples — including voters who were too young to be included in the earlier surveys — the survey is also representative of the national electorate today. We also supplement results from the VOTER Survey with results from Democracy Fund + UCLA Nationscape™, a large weekly survey of voters that is led by a team of researchers from UCLA in partnership with the Voter Study Group and fielded by Lucid.
Primary election narratives frequently center on ostensible divisions within a party because reporters, commentators, and analysts focus on the question of who voters plan to support. When a survey question asks voters to choose their top candidate, it often appears that they are rejecting the others. But many voters may feel favorably toward candidates other than the one they intend to vote for.
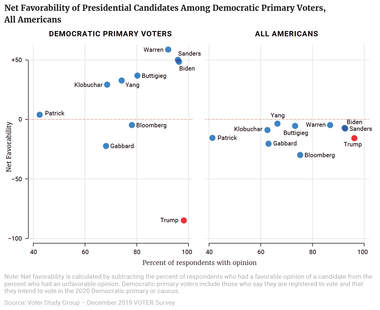
That is exactly what’s happening in the Democratic Party right now. The three leading candidates in national polls, Joe Biden, Bernie Sanders, and Elizabeth Warren, are all viewed favorably by those who say they are registered to vote and intend to vote in a Democratic caucus or primary. For example, 72 percent of likely Democratic primary voters view Biden favorably, while 24 percent have an unfavorable view. This translates to a net favorability rating of +48. Sanders’ net favorability rating is nearly identical (+50), and Warren’s is slightly higher (+59).
Several other candidates, including Buttigieg (+37), Yang (+33), and Klobuchar (+29) have lower net favorability ratings — but this is likely because more Democratic primary voters don’t know enough about them to have an opinion. In general, the more well known a Democratic candidate is, the more favorably that candidate is rated among Democratic primary voters.(1) The exceptions are therefore noteworthy: Both Michael Bloomberg (-5) and Tulsi Gabbard (-22) have a negative net favorability among Democratic primary voters. This points to a challenge for Bloomberg, who has spent about $250 million on his presidential campaign thus far but clearly has much more to do to build support within the party.(iii)
A similar pattern emerges among all Americans. Biden (-7) and Sanders (-4) have nearly identical net favorability ratings in the electorate as a whole — slightly more negative than positive. Warren’s rating is similar (-3) even though fewer voters have an opinion of her. Again, Bloomberg (-28) stands out as particularly unpopular.
(1) This aligns with analysis showing a similar relationship between name recognition and performance in general election matchups: Robert Griffin, “Who’s most electable? Don’t trust polls that match Democratic candidates against Trump,” The Washington Post, November 21, 2019, Accessed January 29, 2020. Available at: https://www.washingtonpost.com/politics/2019/11/21/whos-most-electabledont-trust-polls-that-match-democratic-candidates-up-against-trump/.
Figure 1

If Democratic primary voters are fairly unified in their favorable views of the leading candidates, they are even more unified in their opposition to President Donald Trump. More than 9 in 10 (92 percent) have an unfavorable view of the president and only 7 percent have a favorable view (the remainder have no opinion). An overwhelming majority (87 percent) of Democratic primary voters say that their view is “very” unfavorable.
Trump is also relatively unpopular among all Americans: 40 percent have a favorable view of him and 55 percent have a negative view, which translates to a net favorability rating of -15 (recall, Biden’s net favorability is -7, Sanders’ is -4, and Warren’s is -3). If these levels hold, we’ll see something similar to the 2016 election — a presidential race where Americans have a negative favorability rating for both of the major party candidates.
One piece of consolation for Trump: Both Biden and Sanders have become less popular since the previous VOTER Survey a year ago. In December 2018, Biden and Sander’s net favorability ratings were higher (+12 and +2, respectively). Warren’s standing — which was already net negative at that time – is unchanged. It is possible, then, that a contentious primary and attacks from Trump will make the eventual Democratic nominee even less popular.
When asked who they plan to support, 25 percent of likely Democratic primary voters say Biden, followed by Warren (20 percent) and Sanders (16 percent). These results are similar to polling averages in November and December 2019 — although clearly Sanders has gained some ground since then, while Warren has lost ground.(iv)
This illustrates a challenge facing Warren: Her popularity among Democrats does not currently translate into a plurality of the vote. More than Biden or Sanders, she needs positive outcomes in the early caucuses and primaries to bring Democrats who otherwise like her into her camp.
But even if Warren is struggling right now, she has made the race harder for Sanders. This is clear when we use the VOTER Survey to track the same voters over time and see how Americans’ choices in the 2016 Democratic primary line up with their choices today.
Strikingly, only 16 percent of people who were Sanders supporters in 2016 support Sanders today, at least as of the end of 2019 when this survey was conducted. A larger fraction (42 percent) support Warren, and the rest support some other candidate or are unsure. Sanders likely faces the challenge of consolidating support in a more fractured field, where he is not perceived as the only standard-bearer for transformational politics. Warren articulates similar themes and policy goals.
Given Sanders’ gains since this survey was conducted, more of his 2016 supporters may now support him again — and potentially at Warren’s expense, given her slide in the polls. Nevertheless, Sanders clearly has work to do if he wants to consolidate his coalition from the last election, much less expand that coalition and win the nomination.
Table 1
| 2016 Primary Vote | |||
|---|---|---|---|
| Hillary Clinton | Bernie Sanders | Did Not Vote | |
| Warren | 14% | 42% | 20% |
| Biden | 37% | 7% | 26% |
| Sanders | 4% | 16% | 14% |
| Buttigieg | 12% | 12% | 10% |
| Other candidate | 28% | 15% | 17% |
| Not sure/would not vote | 5% | 8% | 11% |
Clinton supporters from 2016 also have not centered on a single candidate, although a plurality of these voters (37 percent) support Biden. Biden also picks up more votes than any candidate among those who did not vote in a 2016 Democratic primary but say that they plan to do so in 2020.(2) But Biden polls particularly poorly among 2016 Sanders voters, only 7 percent of whom support Biden.
(2) Respondents from 2016 have been matched to state voter files to identify those who did not vote in the 2016 presidential primary, regardless of what they may have reported in the survey.
Competitive primaries always raise concerns about whether the party can unify for the general election — and especially whether the supporters of losing primary candidates will rally to the nominee.
For Democrats, the 2016 election looms large in this conversation. During the 2016 primary, Sanders supporters came to view Clinton less favorably, although some of them did rally to Clinton in the general election. About 8 in 10 (79 percent) Sanders supporters reported voting for Clinton — higher than the percent of Clinton supporters in the 2008 primary who voted for Obama and higher than the percent of supporters of Trump’s Republican opponents who ended up voting for Trump in 2016.(v) Nevertheless, Clinton did fail to capture votes from some Sanders supporters, which was possibly consequential in narrowly divided battleground states.
Could a divisive primary cost the Democratic nominee votes in 2020? Certainly there are warning signs. In Nationscape survey data collected between November 7 and November 13 of 2019, about a quarter each of Biden (24 percent), Warren (25 percent), and Buttigieg (28 percent) supporters said that they were not confident that the 2020 Democratic primary was being conducted fairly. More than one-third of Sanders supporters (37 percent) said the same. These sentiments echo those of many Sanders supporters in 2016, who believed that the Democratic party apparatus unfairly helped Clinton.
What’s more, there are segments of each candidate’s base that simply do not like the other candidates. For example, 43 percent of Sanders supporters and 32 percent of Warren supporters have an unfavorable view of Biden. And 23 percent of Biden supporters have an unfavorable view of Sanders.
Of course, supporters of losing Democratic candidates might be willing to vote for the nominee if only to defeat President Trump. The Nationscape data offer evidence of this. In that survey, respondents were asked how they would vote in potential general election matchups that do not include the candidate they currently support in the primary. Answers to these questions show less risk of party disunity.
For example, when asked how they would vote in a Trump-Biden matchup, only 8 percent of Sanders voters were unsure and 6 percent said Trump — even though a larger number of Sanders supporters have an unfavorable view of Biden. Similarly, only 8 percent of Warren supporters did not choose Biden in this matchup. The same was true for Biden supporters who were asked about a Trump-Sanders matchup: Only 8 percent said they would vote for Trump and 6 percent were unsure. If these numbers hold true in November 2020, there will actually be a remarkably low level of Democratic defection compared to 2016 or 2008.(3)
To be sure, these early numbers may not reflect whether or how people will vote in November. Much depends on how the primaries play out and how enthusiastically the losing candidates unite behind the winner. But it does appear that the Democratic Party may be able to attain a greater degree of unity than many think possible. Undoubtedly, some of this stems from Democrats’ deep dislike of President Trump.
(3) These matchup estimates are from Nationscape data collected between January 9, 2020 and January 22, 2020 among respondents who are say they are registered to vote, that they intend to vote in the Democratic primary or caucus in their state, and that they intend to vote in the 2020 general election.
Given their opposition to Trump, Democrats are grappling with a string of related questions: Which candidate is best able to beat him? How can he be beat? And which groups of voters are crucial? Some advocate for mobilizing loyal Democrats, a number of whom sat out the 2016 election. Others want to focus on swing voters, and especially those who voted for Obama in 2012 but then Trump in 2016.
Because it tracks the same voters across these elections, the VOTER Survey can shed light on this debate. We can break down respondents based on whether they voted for Obama or Romney in 2012 and, from there, whether they voted for Trump, Clinton, another candidate, or not at all in 2016 — and examine how each group favors today’s candidates.(4)
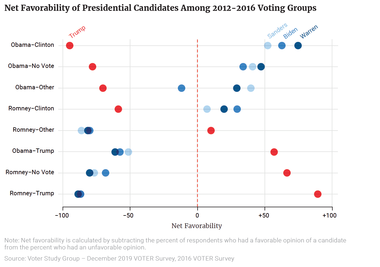
The figure below presents the net favorability rating of Trump, Biden, Sanders, and Warren for these voting groups. The most Democratic-leaning groups appear nearest to the top.
(4) Respondents from 2016 have been matched to state voter files to identify those who did not vote in the 2016 general election, regardless of what they may have reported in the survey.
Figure 2

Unsurprisingly, most Obama-Clinton voters dislike Trump (-95) but favor the Democratic frontrunners, though Warren (+75) is more popular than either Biden (+63) or Sanders (+52). Among those who voted for Obama but then did not vote in 2016, Trump is still unpopular (-78), while the differences across views of Warren (+47), Sanders (+41), and Biden (+34) are less substantial.
However, Sanders (+40) and Warren (+20) are rated more highly than Biden (-12) among Obama voters who selected a third-party candidate in 2016. This likely reflects the appeal of the two more liberal candidates to Jill Stein supporters.
Romney-Clinton voters also appear to be a realistic target for Democrats, given their general dislike of Trump. Among these voters, Biden (+29) is more favored than Warren (+20) and especially Sanders (+7).
Among the other groups, Trump has the clear advantage and no Democrat stands out as uniquely positioned to succeed. In particular, most of the much-discussed Obama-Trump voters appear to be in the GOP’s camp. On average, Trump (+57) is popular with this group and Biden (-58), Sanders (-51), and Warren (-61) are not. This is not to say that the Democratic nominee cannot win over a portion of Obama-Trump voters — just that a large majority seem likely to stick with Trump in 2020.
Two conclusions fall out of this analysis. First, there is a great deal of partisan polarization overall. Very few of these groups appear truly ambivalent about supporting Trump versus a Democratic candidate. Second, among several of these groups, none of the Democratic frontrunners has a notable appeal. The groups differ more on how they evaluate Trump versus the Democrats than on how they evaluate any particular Democrat. This should serve as a caution for overly confident claims about which of the Democrats is more electable in November.
Moreover, public polling that matches Trump against individual Democrats shows not only narrowing leads for those Democrats but smaller differences among them in how they do against Trump. Most notably, Biden’s lead over Trump is now only slightly larger than Sanders’ lead.(vi)
As in earlier election cycles, the usual caveats apply — especially the potential for the primary and general election campaigns to alter voters’ opinions. But right now, there are at least as many factors pushing toward Democratic unity and a highly partisan general election as toward disunity within either party.
Subscribe to our mailing list for updates on new reports, survey data releases, and other upcoming events.