
Key Findings
Partisan affiliation is one of the most stable features of the modern American electorate. While individuals’ feelings toward politicians or their attitudes about policy can change quickly, partisanship is a deep-seated identity resistant to change.
Within the last five years, however, we have observed a significant amount of partisan switching — individuals leaving their party to become independents or join the opposite party. While the overall number of Democrats and Republicans looks stable, a significant 13 percent of partisans have changed their affiliation.
What do these changes mean?
Close observers of recent elections have noticed substantial shifts in Americans’ voting behavior. Demographic and attitudinal dimensions that once played a more minor role in the choices of the electorate have become areas of significant cleavages. The 2016 election was notable for both the sharp divisions we saw around voters’ education levels as well as the increased salience of their attitudes toward immigrants.
It is an open question whether these changes represent a temporary swing or a “new normal” for American political behavior. The results presented in this report suggest that these changes may be more permanent. Many of the shifts in voting behavior have been mirrored by shifts in otherwise stable partisan identities.
Among those who identified as Democrats in 2011, the party has seen its largest losses among older voters, white people without college degrees, economic conservatives, and those with unfavorable attitudes toward Muslims and immigrants.
Among those who identified as Republicans in 2011, the party has seen its largest losses among younger voters, people of color, economic liberals, and those with favorable attitudes toward immigrants.
In December 2016, analysts and scholars from across the political spectrum convened as the Democracy Fund Voter Study Group and helped construct the VOTER Survey (Views of the Electorate Research Survey). This longitudinal survey interviewed 8,000 Americans who had also been interviewed in 2011 and 2012, providing unique insights into the evolving views of voters. In July 2017, 5,000 of these respondents were interviewed again to track their opinions on specific issues as well as to identify changes in their partisan identification.
This report takes advantage of the VOTER Survey’s unique panel design to study changes in partisan affiliation. Instead of looking at aggregate changes in identification over multiple surveys — a more common approach given the relative abundance of these data — we track the same individuals over time. This gives us an unparalleled look into exactly who is changing their partisan identification, what party they are changing to, and the demographic and attitudinal correlates of that shift.
For the purposes of this report, the terms “Democrat” and “Republican” include individuals directly identifying with a given political party as well as those who initially identify as independents but admit to “leaning” toward a political party. “Partisan switchers” are those who self-identified as either a Democrat or Republican in December 2011 and switched their affiliation to something else by July 2017.
Between 2011 and 2017, 13 percent of those identifying as Democrats and Republicans switched their partisan affiliation. Of those, 8 percent began to identify as independents and 5 percent switched between the two major parties. The overall switching rate does not vary much by the respondents’ original party — roughly equal numbers of Democrats (14 percent) and Republicans (13 percent) changed their affiliation during this time period (Figure 1).
Figure 1
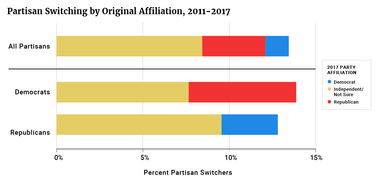
The destinations of these partisans did differ. Former Democrats switched their affiliation to independent and Republican at similar rates (8 percent and 6 percent), while former Republicans switched to independent at about three times the rate they switched to Democratic (10 percent and 3 percent).
Starting after the 2000 election, many observers noticed a sharp, age-based divide in Americans’ voting behavior. Younger voters began to vote for the Democratic Party’s candidates at higher rates while older voters shifted toward the Republican Party.
Party switching over the last five years followed a similar trajectory. Democrats lost older voters while Republicans lost younger ones (Figure 2). Older Democrats — those ages 45 and up — switched at a high rate (16 percent) with more than half of those switchers now describing themselves as Republicans. In contrast, the youngest Democrats — those 18 to 29 years old in 2011 — had the lowest switching rate (10 percent) and less than one in 20 changed their affiliation to Republican.
Figure 2
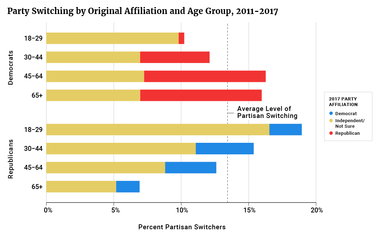
The relationship was reversed for Republicans. Among those who identified as Republicans, 18 to 29 year olds were the likeliest to switch (19 percent) and those age 65 years or older were least likely to do so (7 percent).
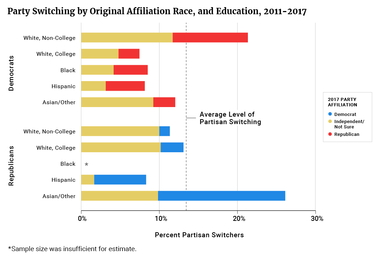
There were also distinct switching patterns among different race and education groups. Among those who identified as Democrats, white people without college degrees were most likely to switch their affiliation. One in five no longer identify as Democrats with nearly half of those switchers now viewing themselves as Republicans (Figure 3). The switching rate among white Democrats with college degrees and Democratic people of color was below average — 7 percent and 9 percent, respectively.
Among Republicans, the switching rate was slightly below average for white people with and without college degrees (11 percent and 13 percent). In contrast, about 17 percent of those people of color identifying as Republican have switched affiliations with almost 60 percent of those switchers now identifying as Democrats.
Figure 3
Americans’ vote choices in the past two elections also provide a useful lens for understanding partisan switching. In the aggregate, all voters shifted slightly toward the Republican Party and away from the Democratic Party — 4 points more and 2 points less, respectively (Figure 4). Trump voters displayed an exaggerated version of this same pattern with an 11-point increase in Republican affiliation and a 7-point decline in those identifying as Democrats.
The group to undergo the largest shift, however, has been the much discussed Obama to Trump voter. Within the last five years, they have shifted 28 points away from the Democratic Party and 43 points toward the Republican Party. To put this in context, while about 50 percent of these voters identified as Democrats or Democratic-leaners in 2011, only 22 percent do so today. Republican or Republican-leaners once constituted a small portion of this group (16 percent), but make up a majority now (59 percent).
Figure 4
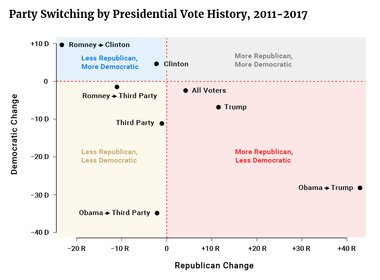
Clinton and Romney to Clinton voters experienced similar, if smaller, shifts compared to their Trump and Obama to Trump counterparts. A larger share of Clinton voters and Romney to Clinton voters now identify as Democrats (5- and 10-point shifts) while the share of self-identifying Republicans has declined (2- and 23-point shifts).
Overall, third party voters were 11 points less Democratic and 1 point less Republican than they were in 2011. Obama to third party voters showed an even larger shift away from the Democratic Party during this time period — a 35-point decline. Romney to third party voters were a mirror version of third party voters overall, becoming 11 points less Republican and 1 point less Democratic.
We now have a fuller picture of partisan switchers, but this tells us little about their beliefs. What attitudes and ideologies had a relationship to partisan switching and did these relationships vary for Democrats and Republicans?
To examine these questions, I have used the ideological and attitudinal measures developed for John Sides’ initial report for the Voter Study Group.1 While we have respondents’ answers to these questions from the most recent 2017 wave of the survey, we use the responses from 2012 for our analysis.
We did not use the more recent measures because individuals may have shifted their views to align more closely with their current partisan identity — lowering the dissonance between their beliefs and those commonly associated with their new affiliation. If we used the 2017 data we would have to ask ourselves: Did this person switch parties because they had this attitude or does this person have this attitude because they switched parties? Luckily, the 2012 data we have collected can help avoid this problem as they were taken prior to any of the partisan shifts we have observed.
The sections below highlight the results of my analysis,2 but in short:
1See Appendix for fuller description of measures taken from John Sides, “Race, Religion, and Immigration in 2016,” Voter Study Group, June 2017. Available at: https://www.voterstudygroup.org/publications/2016-elections/race-religion-immigration-2016.
2See Appendix for fuller description of models that produced these results.
Figure 5
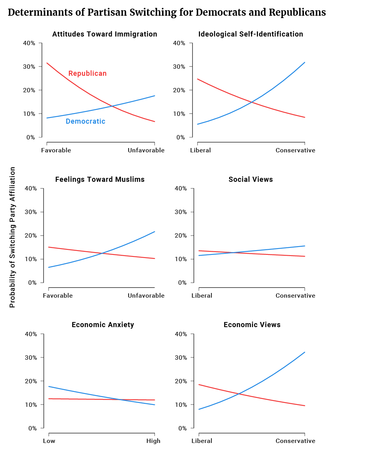
For the last two years, few topics have been as central to American politics as the role of immigrants and Muslims in society. It should come as little surprise then that Americans’ views on these groups have become an important determinant of partisan identity. Negative views of these groups among Democrats and positive views among Republicans were correlated with a change in partisan affiliation.
For Democrats, those with very unfavorable attitudes toward immigrants and immigration were about 10 points more likely to switch than those with very favorable views. There is a similar if slightly more substantial relationship for those with unfavorable and favorable views of Muslims — the former being about 15 points more likely to switch than the latter.
Among Republicans, the opposite is true. Respondents with very favorable views toward immigrants and immigration in 2012 were 24 points more likely to switch than those with very unfavorable views. The relationship is similar for Republicans’ attitudes toward Muslims, but we would only predict a 5-point change in the probability of switching — a relationship that is not statistically significant at traditional levels.
For both Democrats and Republicans in our sample, ideological self-placement had a large impact on the likelihood of switching party affiliation. This is not a surprise given the ongoing and well documented sorting of the American public into more ideologically cohesive parties.(i) Those identifying as liberal Republicans were 19 points more likely to switch than their conservative counterparts. Compared to their liberal counterparts, conservative Democrats were 26 points more likely to change their partisan affiliation.
However, we don’t necessarily see the same relationship for social and economic views, two of the most common elements of American political ideology. Economic views are strongly predictive of partisan switching while social views appear to have a negligible effect. Democrats with conservative economic views were 24 points more likely to switch than their liberal counterparts. Among Republicans, those with liberal views were 9 points more likely to switch than their conservative counterparts.
One of the major narratives to emerge from 2016 was that Americans’ economic concerns played a more significant role than they had in previous elections. As the story goes, a slow and unequal recovery from the 2008 recession fueled economic anxiety that, in turn, propelled Trump into the White House.
We might expect these economic concerns to bleed over to partisan switching, but those expectations would be wrong. It was actually those Democrats who felt least anxious who were the most likely to switch their affiliation. The least anxious were about 8 points more likely to switch than the most anxious. The effect of economic anxiety among Republicans appears to have had a negligible relationship to their propensity for switching.
The changes documented here will probably disadvantage the Democratic Party in the short term and pose a considerable problem for Republicans in the long term.
For the Democratic Party, the loss of white people without college degrees is highly problematic. For starters, this group is a larger share of the electorate than is commonly understood. While the national exit poll of the major networks and the AP indicated that non-college white voters made up 34 percent of voters in 2016, the actual number is probably closer to 45 percent.(ii)
Even small losses among these voters can have a decisive impact on parties’ electoral fortunes — particularly in state and local elections. The reason for this is that non-college white voters are well distributed throughout the country for the purpose of political representation. With few exceptions, they make up a significant, if not overwhelming, portion of voters in counties across the nation. This geographic dispersion makes them influential in every state and in a disproportionate number of congressional districts (Figure 6).
Even if it were the case that the Democratic Party was making more enduring inroads with other demographic groups, these other groups are presently distributed in comparatively inefficient ways. White people with college degrees, for example, are not only a smaller group but also tend to be clustered in densely populated areas. The fastest growing groups — Hispanics and Asians — are well represented in a relatively small number of counties located in electorally uncompetitive states. Additionally, black people already identify as Democrats at such high rates that further gains among them would be marginal at best.
Equally problematic for Democrats is the loss of voters from older age cohorts. Not only are those 45 years of age and older significantly more likely to vote, but they are also especially reliable voters during midterms when turnout is down overall. Even if a majority of the younger voters departing the Republican Party found their way into the Democratic camp, their lower participation rates would still make it an uneven trade.
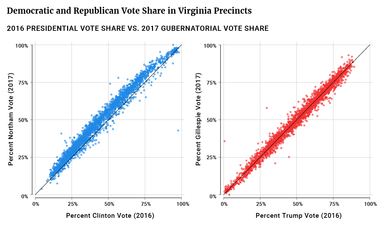
Exacerbating both these problems for Democrats is the increasingly nationalized nature of our elections. Over the last several decades, presidential results have become more predictive of state and local elections. The precinct-level results from Virginia’s 2017 gubernatorial election, for example, were highly correlated with the presidential results we saw in 2016 (Figure 7). Even if 2018 is a wave election for Democrats — a proposition that seems well supported — it is not clear that they would win the House given that they are losing the voters who wield an outsized influence in off-year congressional races and how closely these results may resemble the 2016 election.
Figure 6
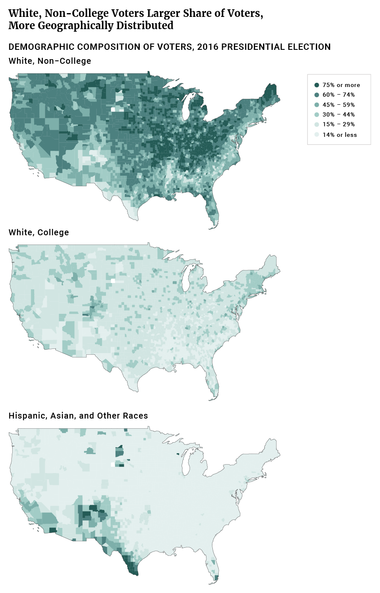
Figure 6(iii) uses estimates and data outside of the 2017 VOTER Survey. Please see endnotes for a complete list of sources.
Figure 7
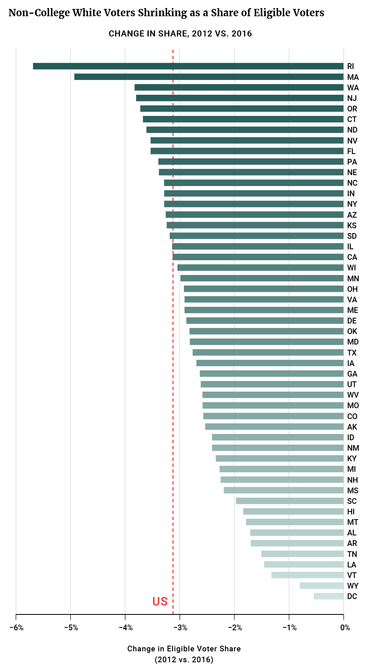
All that said, these trends also suggest long-term difficulties for the Republican Party. Non-college white voters still make up a substantial part of the electorate, but they have been shrinking for over 30 years. Between the last two presidential elections, the percent of eligible voters who were white without a college degree shrunk from 49 to 46 percent. Furthermore, this population did not grow or hold steady in any single state (Figure 8). There is little reason to suspect that this trend will stop or even slow in the near future.
Additionally, Republican losses among younger voters represent a significant and potentially existential problem for the party in the long term. Generally, partisan identity is more fluid during young adulthood and then it hardens later in life becoming “sticky” or resistant to change. If Republicans continue to lose new cohorts of young voters — something they have been doing since 2004 — young people’s loyalty to the Democratic Party may become entrenched. While the relative youth of the millennial generation has blunted their electoral impact, millennials are now poised to overtake baby boomers as the largest generation among eligible voters.(iv) It is only a matter of time before this generation begins to exercise its political power in full.
In the same vein, people of color are rising as a share of the electorate. While the geographic distribution and relative youth of these voters has thus far muted their electoral impact, any viable party coalition must include a substantial portion of these communities in the long run. The Republican Party’s continued inability to attract a larger share of these groups augurs electoral misfortune.
Figure 8
The measures used in this report are borrowed from John Sides’ original report for the Voter Study Group. They are scaled from zero to one. As he described them in the original report:
1The four items ask how much respondents agree or disagree with these statements: “Over the past few years, black people have gotten less than they deserve”; “Irish, Italian, Jewish, and many other minorities overcame prejudice and worked their way up. Black people should do the same without any special favors”; “It’s really a matter of some people not trying hard enough; if black people would only try harder they could be just as well off as white people”; and “Generations of slavery and discrimination have created conditions that make it difficult for black people to work their way out of the lower class.”
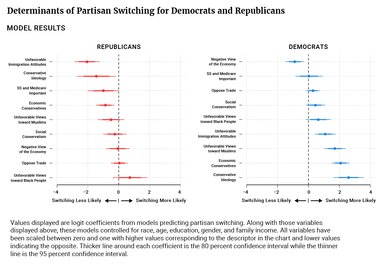
The results presented in this paper are output from logit models predicting partisan switching among Democrats and Republicans. Respondents were coded zero if they had a stable partisan affiliation in 2011 and 2017 and one if they changed their affiliation to independent or the opposite party. Along with those factors displayed in Figure A1, models included variables for race, age, education, gender, and family income.
The relationship between each factor and the probability of partisan switching for those who identified as Democrats and Republicans in 2011 is displayed below. Each point is a coefficient from a statistical model that accounts for all these factors at the same time while the lines around the points are confidence intervals — measures of uncertainty for a coefficient not unlike the “margins of error” one would see in a poll.
Points to the right of the dotted line means that higher values of the factor in question made partisan switching more likely while dots to the left of the dotted line indicate that it made switching less likely. If the confidence intervals around the dot significantly overlap the dotted line at zero, then that factor’s effect is too small or the data too “noisy” for us to confidently determine the direction of the relationship.
Subscribe to our mailing list for updates on new reports, survey data releases, and other upcoming events.